Earlier this year I tried to create a GPS race replay using Ride With GPS. It worked, for the most part, but was hampered by a complicated setup, as well as RWGPS’ relatively smaller user base and its inability to work with multiple lap courses.
Then out of the blue I got a tweet from Ben Lowe, creator of VeloViewer and VeloFlow. Ben had done exactly what I had wished for with VeloFlow, using Strava’s gigantic database. I was so pleased I didn’t mind that Ben informed me by calling me out for wheelsucking.
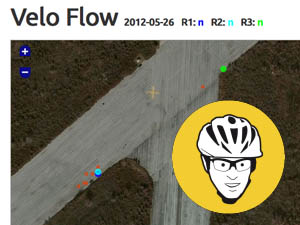
Watch Andy Shen of @nyvelocity race around Central Park via #VeloFlow on.fb.me/T2uXQf Looks to be sitting in to me! #Strava #cycling
— VeloViewer (@VeloViewer) December 17, 2012
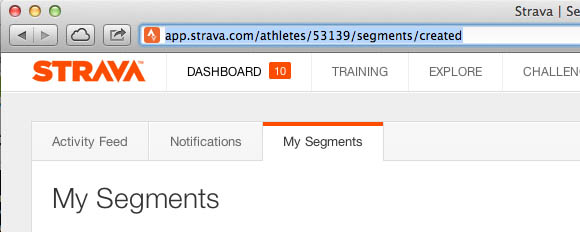
Here’s how it works. VeloViewer is a ‘Strava dashboard’, a site that takes your Strava data and parses it to reveal more detailed metrics (see the list here). To get started get your rider ID from Strava by selecting ‘My Segments’. Your rider ID is the number in the URL – mine is 53139.
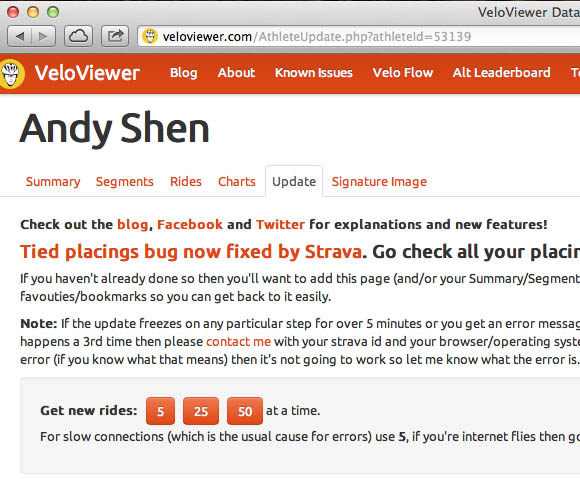
Next plug it into VV’s homepage. Go to the ‘Update’ tab and download all your rides and you’re in. Once you’re in you can move on to VeloFlow, the race/ride visualizer.
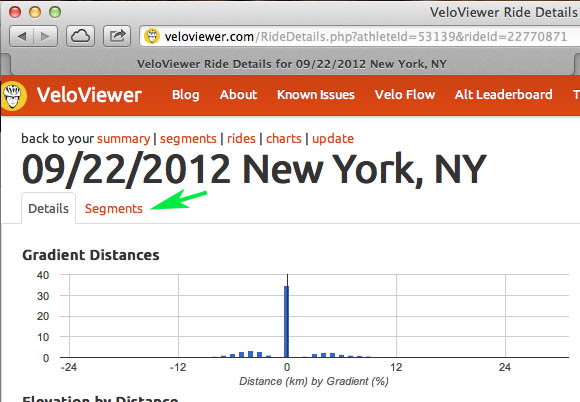
A VeloFlow is a compilation of all the rides that covered a given segment on a given day. The rides are visualized as a map with a 24 hour slider at the bottom, and every rider on that day is animated on that map as a dot. To make one start by going to the ‘Rides’ tab on your VV summary page, and clicking on a ride or race. From the ride page, click on the ‘Segments’ tab. This will lead to a list of all the segments covered on that particular ride.
This particular ride was a Central Park race, and it contains a whopping 386 segments! Since I’m interested in compiling all the racers who used Strava that day, I’m going to choose a segment that’s a part of the race course. In other words, I’m not going to choose a segment that’s from my ride to the course, as that won’t capture racers who arrived at the course from another direction. You’ll also capture all the non racers who rode that segment, but don’t worry about them. Clear as mud? Once you’ve chosen a segment, click on the black VeloFlow arrow from that row in the second to last column. You’ll be taken to a new browser tab with these options:
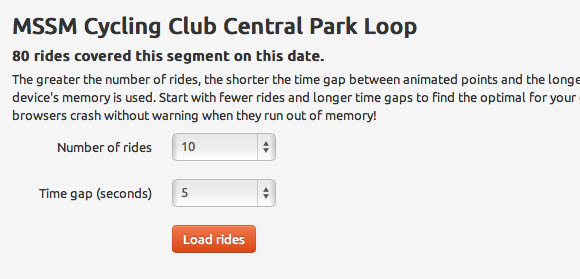
As you can see, 80 Strava users covered that segment on that day. You can choose how many riders you want to display, and how fine the resolution of the animation will be. The more riders you have, the bigger the time gap. Smaller time gaps make for smoother animation when zoomed in. Click ‘Load rides’ and the animation will be generated. Here’s the URL of this VeloFlow if you want to try it for yourself.
When the animation is generated the zoom level will be set to cover your entire ride. You can choose to zoom in or out, and you can choose to auto center the map so you don’t ride off the page. Different frame rates control the animation speed. The slider will be positioned at the start of your ride. In this particular example it starts at 6:13 in the morning, when my ride began. View options include street map, topography, and satellite.
Now, let’s take a look at the URL of the VeloFlow:
veloviewer.com/VeloFlow.php?activityId=22770871&segmentId=648046&date=2012-09-22
As you can see, it’s defined by an activity ID (my ride file), a segment ID (the segment I decided would best capture other racers), and a date. Since it’s based on my ride file, I appear as a big blue dot. If you delete the activity ID from the URL then the VeloFlow will be an aggregate of all the rides, without a ‘protagonist’. The zoom level will cover all the rides, and the time slider will start where the first riders starts.
If I wanted to see more riders identified in the animation, I can first go to my ride file on Strava by adding the activity ID to this URL:
http://app.strava.com/rides/22770871
Go to that activity page, and you’ll see who else was there. Click on one of the other riders and you’ll be taken to their activity page.
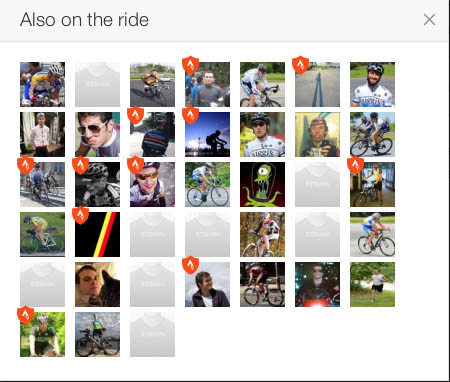
Pull their activity ID from that URL, and add it to your VeloFlow URL, right after your activity ID, with a comma in between like so:
http://veloviewer.com/VeloFlow.php?activityId=22770871,22796808,23016386&segmentId=648046&date=2012-09-22
Here’s an example of a multi rider VeloFlow, at scenic Floyd Bennett Field. Note the color key at the top.
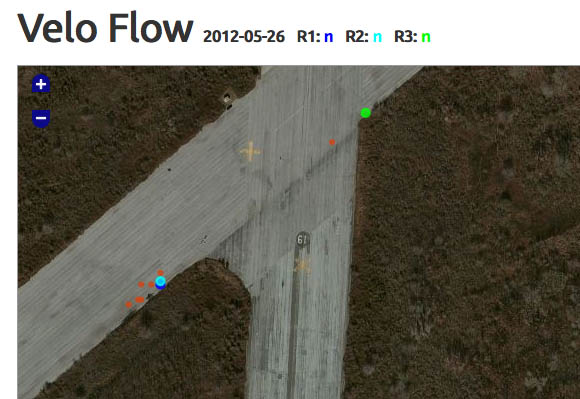
And you’re done. Phew. Now play that thing and make a screen recording. You’ll need to go full screen and 720 or 1080p to see it clearly (this video was made with just one highlighted rider, me). This was a 3 3/4 lap race that ended at Tavern on the Green (west side at 67th street). You can see me get away (:50), get caught at the northern end (1:10), at which point two guys slip away and hang on for over a lap before they’re swept up (1:38) just before the finish (1:42). You can even see me double back to watch the other finishes, then ride to the parking lot.
And there you have it. So next year load your files to Strava and we can see all the races played out. If you don’t have a GPS computer install the Strava app to your phone and keep it in your back pocket. In the meantime you can load your old rides to VeloViewer and relive past glories, or, as the case may be, indignities.
very cool guys, great work; bike racers competing in the park, look like a plethora of sperm swimming into a dark place………
if someone sends me a pack of beers I’ll add sperm tails to the riders.
As if I don’t spend enough time on this “hobby” already. Training, racing, traveling to races, reading nyvelocity and now watching my races all over again.
woo hoo. One of those red dots is me! I wonder if this is my 15 mins…
Thanks guys
Can someone please set up a donation page for VeloViewer to get the tails enhancement?!
Should I ever make it to New York I expect to be suitably supplied with beer:
http://veloviewer.com/VeloFlow.php?activityId=9375417,9385408,9493079&segmentId=1692894&date=2012-05-26&a=10
Go 1 second time gap and all riders.
(just add the “&a=10” to end of any VeloFlow URL for sperm, change 10 for longer/shorter wrigglers. For full on sperm attack add “&b=1” to the end)
My work here is done.
Let there be beer!
One of those dots look like its on EPO. It got to Harlem Hill in 2 minutes.
won by 16-year-old Adrien Costa: climb starts @ 10:00. Multiple groups, but 1-2 and 3 start first.
http://veloviewer.com/VeloFlow.php?activityId=35182365&segmentId=378701&date=2013-01-01
Here’s a CX race Ben did using the sperm tails. He set the tail length to 60 seconds, so you can see when the winner gets a minute gap. Pretty cool.
http://veloviewer.com/blog/velo-flow-how-to-and-secret-features-videos/
Ride with GPS is thrilling and interesting while at ride and I am glad to appreciate the taking effort for this blog. frameless glass shower doors