
I’ve been playing around with the Chung Method for a while, and I’ve found a way to use it to pry apart Crr and CdA from a ride file.
But first, a quick intro to the Chung method. There are many unknowns in the equation for bicycle forward motion. If you ride with a power meter you can know all but four of the unknowns: Crr, CdA, wind, and road slope. Therefore, if you make an educated guess for your Crr and CdA and ride on a still day, you can solve for road slope.
A power meter reports data for set intervals (for the Quarq and the SRM that interval is 1 second), so if you know the road slope for that interval and you know your speed, you can figure out how far you traveled horizontally and vertically. Do this for every second, connect the little lines, and you have a virtual elevation plot of your course.
If your Crr and CdA guesses are correct, then the virtual elevation plot would resemble the real course, with the same net elevation change. If it doesn’t, tweak Crr and CdA until it does. And just like that, you have a rough estimate of your Crr and CdA using nothing but a power meter.
The problem now is that the wrong Crr and CdA combination can also make the elevation plot look right as long as the total average force is correct, so you can never truly solve for either with complete confidence.
This is where my discovery comes in. Rolling resistance force remains constant regardless of speed, while aero resistance increases with the square of speed. So relatively speaking, rolling resistance contributes a bigger percentage to total resistance at lower speeds than higher speeds, and vice versa for aero resistance. If you get your Crr/CdA combination wrong the Chung calculations will be slightly off at the high and low ends of the speed scale.
The problem with a typical ride file is that the speeds are randomly dispersed throughout the file, so any errors will be hidden and averaged out in the final plot. But if you had a ride file where you steadily accelerated (or decelerated), then the left half of the plot would be lower speeds, and the right half would be higher speeds.
Here’s a diagram Robert Chung made after I explained my method to him. It’s the steadily accelerating ride I did at Kissena, as indicated by the speed graph on top. Since it was done on the track net elevation change should be zero. The spikes in the graph are from turning forces. The black line is the elevation plot when Crr and CdA are just right.
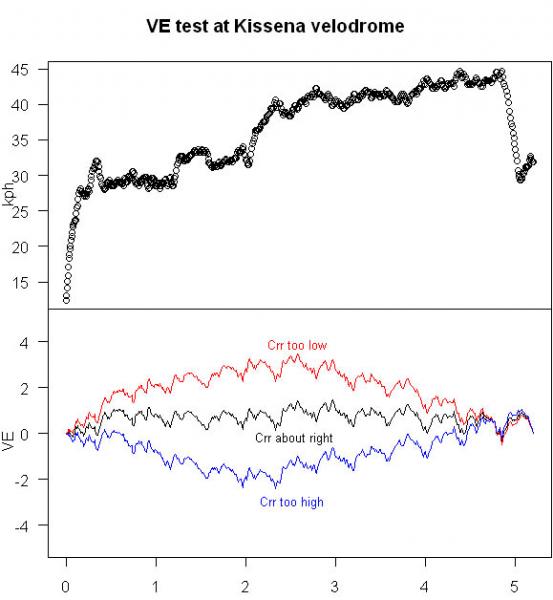
Now let’s look at the red line. If your Crr guess is too low, you can still increase your CdA to compensate and zero out net elevation. On a typical ride file you’d never be the wiser. But since speeds are segregated on this file, you can see that the slope is wrong for each half, resulting in a bowed elevation plot.
Since Crr contributes more to total drag at low speeds, a low Crr estimate will yield a lower resistance calculation than actual resistance on the ride. This means your actual speed will be lower than the amount of calculated drag would indicate. The calculations need to find another reason for your slower than expected speed, so it puts you on an upslope instead of level ground. That’s why the left half of the red plot goes uphill. Flip this logic over three more times and you’ll see why the other half of the red plot goes downhill, and why the blue plot bows down.
So there you are. Do a steadily accelerating or decelerating ride on level ground, tweak the Crr and CdA until the plot is both level and straight, and you’ve achieved the separation of Crr and CdA.
Everybody Wang Chung tonight.
Very cool!
Will try this myself at some stage in not too distant future and report results.
Way cool!