
![]() Golden Cheetah is a free of charge open source performance analysis application that runs on Linux, Mac, and Windows. Originated by Cat 1 racer Sean Rhea in 2006, GC arose from Rhea’s simple desire to download his rides direct to his Mac. Since almost all his cycling friends were engineers, Rhea thought GC would be perfect as an open source project. After two years of working primarily with Robert Carlsen and Justin Knotzke, GC grew from a command line tool to having a graphic user interface. "Once we went graphical and added a couple of base features that made it more usable for people and their daily training we got more of an audience," says Carlsen. That audience recently hit critical mass, and the users’ mailing list buzzes with constant activity as patches are added and debugged, and new features are proposed and debated.
Golden Cheetah is a free of charge open source performance analysis application that runs on Linux, Mac, and Windows. Originated by Cat 1 racer Sean Rhea in 2006, GC arose from Rhea’s simple desire to download his rides direct to his Mac. Since almost all his cycling friends were engineers, Rhea thought GC would be perfect as an open source project. After two years of working primarily with Robert Carlsen and Justin Knotzke, GC grew from a command line tool to having a graphic user interface. "Once we went graphical and added a couple of base features that made it more usable for people and their daily training we got more of an audience," says Carlsen. That audience recently hit critical mass, and the users’ mailing list buzzes with constant activity as patches are added and debugged, and new features are proposed and debated.
Early on, the trio decided on something that has become the GC philosophy. "We want to allow everyone to see their data the way they want," says Knotzke, "as long as we don’t lie to the user, it’s good to go". Therefore, all files are saved in their raw form. Any alterations to the file are saved as a .gc file in xml format, so your original data always remains pristine. Adds Carlsen, "We can sit in this center spot and say, ‘Do whatever you want, use whatever hardware you want, and you can analyze it here, and it’s all your data, it’s all open.’" GC reflects the do-it-yourself spirit of its creators: it provides many analysis tools for its users without imposing its own interpretation.
One key difference between open source and commercial models is that programmers only work on what they want to. Features and support are usually added only when someone needs it for himself. If none of the frequent contributors owns a certain device, it may not be supported. So despite the somewhat altruistic feel of the community, most are actually motivated by self interest. Or, as Carlsen puts it, "if you have an itch you want to scratch, you can contribute something that many many people might find useful." Conversely, if you have an idea good enough to excite the community, you can have some really smart people build you something for free.
The result are programmers that are extremely passionate about the product, with a very strict gatekeeper in Rhea who ensures that the GC code is clean and elegant. Says Knotzke, "if you report a bug to the mailing list, you don’t get a customer service person. You get the guy who wrote the code, and he’s going to take it personally, and he’s going to fix it right away."
 Rhea compares the open source ethos to publishing in the scientific community, where one must show data to back up claims. Likewise, all the code for GC is public. "The biggest compliment you can get is that other people build on your ideas. A (scientific) paper that is never referenced is the worst paper ever. You WANT other people to take your best ideas and make them better." Rhea is most pleased that GC provides the framework onto which people can easily implement new things.
One example of this is Aerolab, a module that will be included in the next version of GC. Rhea: "One of the things that really excites me about Golden Cheetah is that it’s a platform for somebody like Andy Froncioni to expand on Robert Chung’s work. Without the ability to import all these file types, without the framework there to analyze the files, all you end up with is a bunch of Excel spreadsheets. It’s easy for someone who’s really motivated to sit there and do it for their own files, but it’s really hard for them to share it with anyone else in a meaningful way." 90% of what Froncioni needed was in place. He got the idea and sent Rhea an algorithm. While Rhea was pondering it Froncioni mocked up an interface, enlisted Knotzke’s help to learn the programming language and coded the first version of Aerolab. Aerolab could never have gotten off the ground if GC and its community of programmers didn’t exist.
GC is in an interesting phase right now. "The basics are there, now comes the fun stuff," says Knotzke. While Rhea had to reverse engineer Powertap downloading in the beginning, Saris and Quarq now offer their code so GC can support their devices. The speed at which things develop can be downright dizzying. The hot topic of the moment is overlaying power data onto GPS mapped routes. While some users debate its usefulness, others are already getting it up and running, all in the space of 48 hours. The feature will probably be included in version 1.4.
Version 1.3 is available for download at the GC site. You can download direct to GC with SRM and PT, other format files can be dragged and dropped in. Once installed you can load your history of rides. Enter your FTP in preferences and the charts and graphs will be shaded in your zones. Since the GC guys are more keen on programming than writing user manuals, here’s a quick walk through of some of GC’s features.
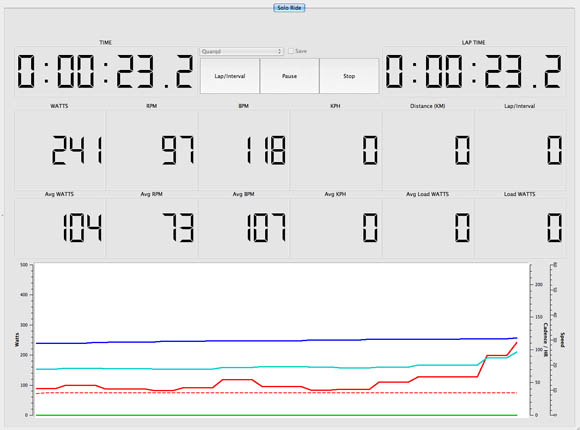
The top left menu has two options: Ride Analysis View and Training and Racing View. Training and Racing View gives you a live dashboard and graph of your trainer or roller ride. You’ll need an ANT+ USB receiver plugged into your computer. GC fully supports the CompuTrainer, so you can control it from your computer. Once you complete your ride the file is saved in GC, no need to download. All the following screengrabs will be in Ride Analysis View.
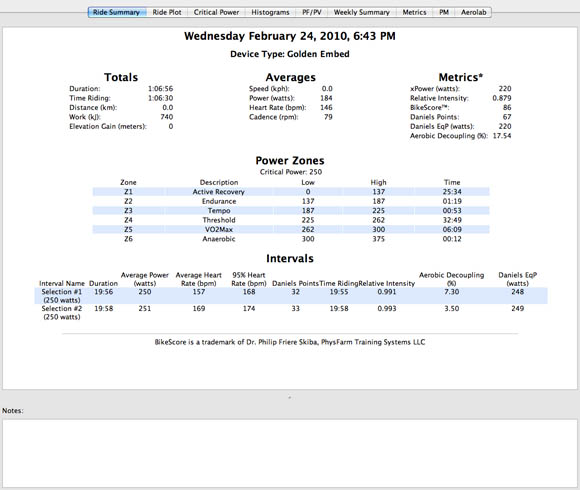
Here’s the Ride Summary tab, where all the vital stats of your ride reside. GC uses a couple of metrics to rate the intensity of your rides: BikeScore and Daniels Points. I particularly like how all the data of your intervals is laid out in one page, makes it real easy to send off your stats to your coach. If you type ‘race’ in the notes field the ride will show up red in the calendar, ‘sick’ makes the ride yellow.
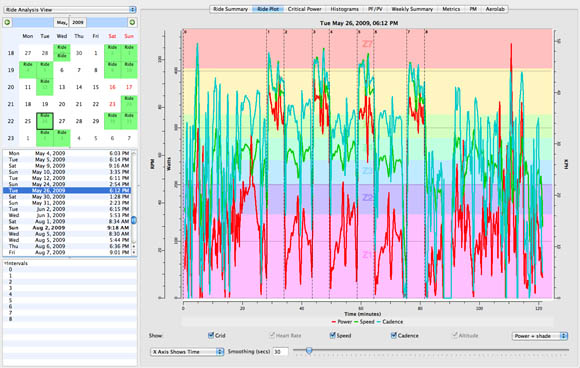
Here’s a hidden trick in the Ride Plot tab. If you shift-click and drag on the plot you can create an interval, and it’ll appear in the interval box on the left. Click and drag on the ride plot to zoom in, right click to zoom out. Once you set up your zones they’ll appear in all the charts in GC.
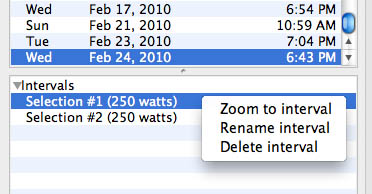
Right click on the interval and you have some more options.
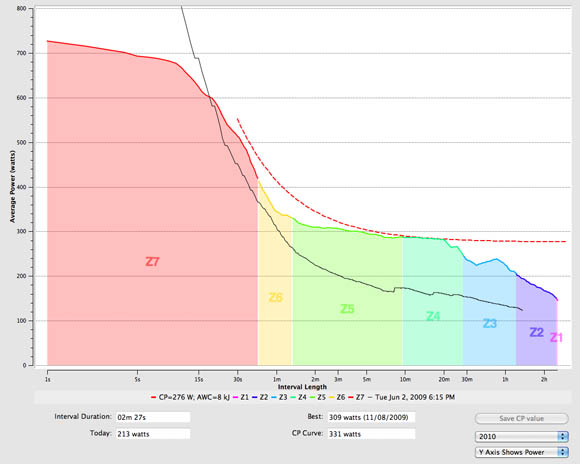
The Critical Power tab shows the inverse relationship between power and duration. You can compare your all time bests for any time interval with the ride you just did.
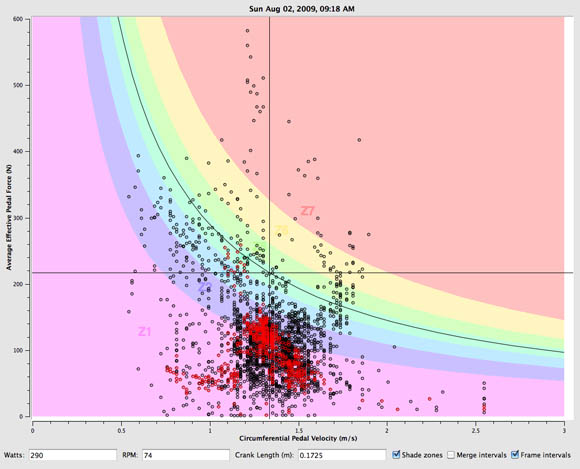
The PF/PV tab plots pedal force against pedal velocity. When you select an interval the data points from that interval are highlighted.
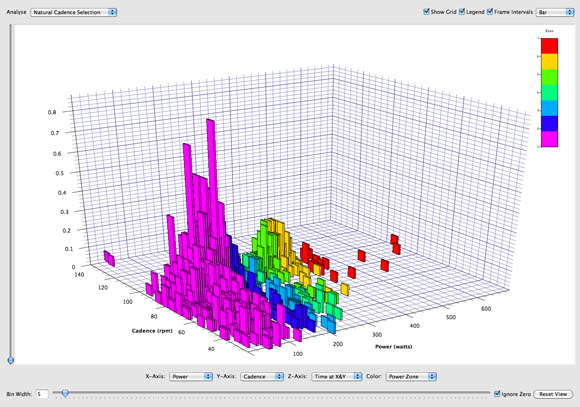
Here’s the 3d plot. It comes with a few preset views (this one is Natural Cadence Selection, which plots cadence v power v time spent), but you can specify any 3 parameters to plot. Click and drag in the window to rotate the plot, scroll to zoom in and out. The scroll button on the left ghosts out data from the bottom up.
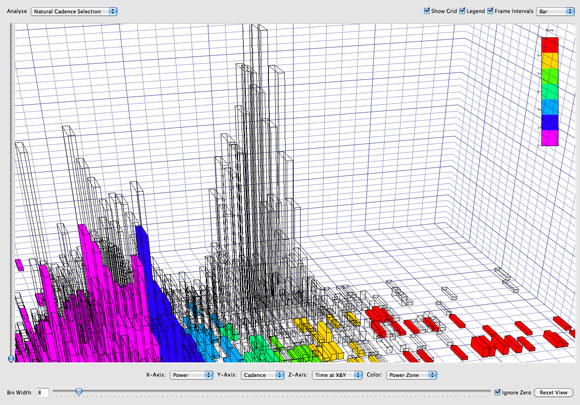
Here’s the 3d plot zoomed in. Just as in the PF/PV plot, if you click on an interval those data points are highlighted while the rest of the ride is ghosted.
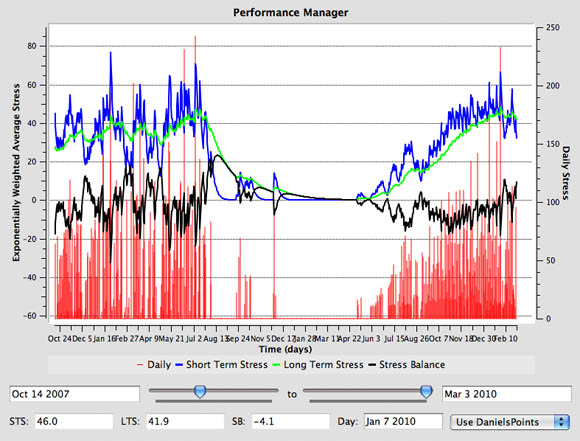
The Performance Manager tab lets you plan your training using BikeScore or Daniels Points. Rhea is in the midst of a long term experiment, using Daniels Points to plan his training. He’s comparing this year’s training, where his job is limiting his time on the bike, to his training from 2007, where he had much more time to train.
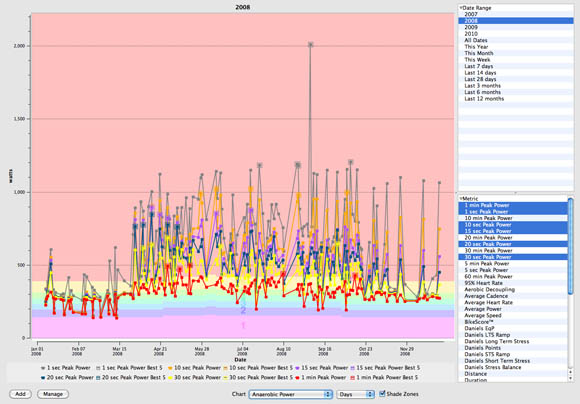
Here’s a preview of a couple of features slated for version 1.4. Long Term Metrics, coded by Mark Liversedge, lets you chart any parameter you want over time – one minute power, one hour power, HR, Cadence, BikeScore, distance, duration, average speed, you name it.
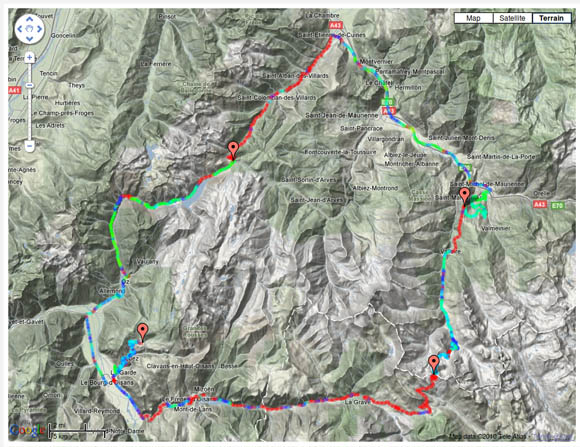
Here’s what GPS mapping might look like in GC. You’ll be able to see your ride in Google Earth view, with power indicated in your zone colors along the route. Click on a point in the ride for power at that point.
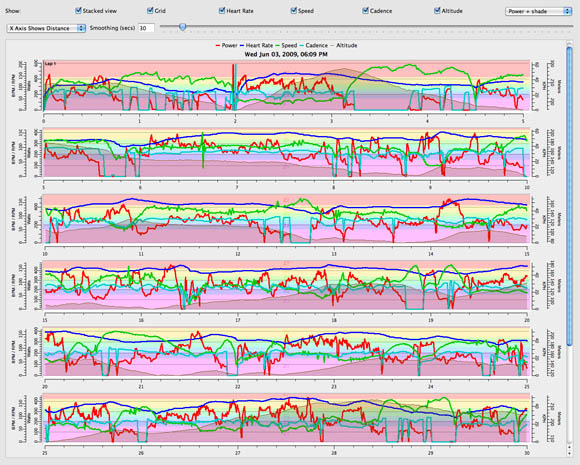
1.4 might have a stacked view of the ride plot, a Damien Grauser contribution.
Hey! Why isn’t this featured on the site, I found it because my Blackberry listed it and it fit the screen so not easily avoided.
Its the future of data analysis for those with Power Meters.
I smoked some Golden Cheetah in Vancouver. Got me high as balls.
Can it measure fun?
This “project” is really exciting.
lol @ 7:35
can you just point it to a current SRM data folder or do fiels need to bne imported? Very clean looking, nice features.
stopwatch and 1/4 mile, the rest is all bells and whistles, smoke and mirrors,
stick to spit grit and duct tape…
So if I go time myself with a tailwind then I can turn pro?
I just deleted my rant…thank goodness…nobody got hurt in the making of this comment…
this is so cool. thank god now i can 3d scatter plot the reason why i still suck.
Great to read a review on it. The potential for power laid onto GPS mapping would make finding segments w/in a ride or race super easy. Looking forward to that!
As a mac user that got frustrated using WKO+ in Parallels, I tried GC last year, and am now amazed by how far they’ve come, and am greatly enjoying using it. The group is very responsive to quirks that only you ran across, and interested in new ideas. They’re next update should be to add a pay pal button for contributions!
3D graphical data. I can use my rides as departure point architectural form language. Love the google mapping relationships too! One could really carve up some background on a race course with this stuff. Very genius.
yes i’d rather spend a mountain of time and data crunching to identify where my shortcomings will be, as opposed to, say, listening to someone experienced tell me, “at mile 13, stay at the front, puke if you have to, but don’t get dropped. if you get dropped, you’re fucked.”
Who told you it had to be one or the other, dumbass?
yes i’d rather spend a mountain of time and data crunching to identify where my shortcomings will be, as opposed to, say, listening to someone experienced tell me, “at mile 13, stay at the front, puke if you have to, but don’t get dropped. if you get dropped, you’re fucked.”
this comment is so colossally stupid, it needs to be broken down.
#1 you need someone to tell you not to get dropped? that’s your idea of sage advice?
#2 why not train hard and train smart and be the one dishing out the punishment?
#3 as stated below, you can train smart and take advice too. not mutually exclusive.
#4 when the pace picks up, what do you think keeps you from getting dropped? training? or the fact that someone told you not to get dropped?
is that what your online coach told you?
ooooooo, pretty….last year i was really into the wattage scene but it overwhelmed me, and i didn’t get fast; i’ve since gone retro; gc looks good and being f/oss is awesome, but i don’t think it has enough power to pull me back from the 1990’s because i kind’o like it here/there
crap – i just posted to a zombie thread
Is there some kind of user guide to tell you how to use the data? I am new to using a power meter and am trying to get the most out of it but not really sure how to use all the features of GC.
Take a hit of acid then stare PF/PV tab plots. Let us know how that went and if you now more fully understand the cosmic relationship of it all.